Limpopo forms part of a changing national map of adult illiteracy, with new Census analysis showing that areas of lower illiteracy extend into parts of the province, while high-illiteracy clusters have become less widespread since 1996.
The spatial analysis, based on Census data from 1996 and 2022, shows how the geography of adult illiteracy has shifted over more than two decades. While strong pockets of high illiteracy remain in parts of KwaZulu-Natal and the Eastern Cape, large areas of the country no longer show statistically significant clustering.
Limpopo appears within the broader low-illiteracy pattern surrounding Gauteng, although substantial parts of the province were classified as not statistically significant in the 2022 analysis.
The findings come during Literacy Month, with International Literacy Day observed on 8 September, providing a timely look at how adult illiteracy has changed since the first democratic Census.
Limpopo’s place on the literacy map
The analysis uses educational attainment as a proxy for functional literacy because Census data does not directly measure literacy proficiency.
People aged 20 and older with no formal education or whose highest level of education was below Grade 7 are classified as functionally illiterate. Those who completed Grade 7 or higher are classified as functionally literate.
The analysis then looks beyond individual districts to establish whether neighbouring areas show similar patterns.
A hotspot is an area where high levels of adult illiteracy occur together across neighbouring areas. A cold spot is where low levels occur together. The analysis tests whether these patterns are statistically significant rather than simply identifying places with high or low values.
In the 1996 Census, significant cold spots of low adult illiteracy were concentrated around Gauteng. The pattern extended into neighbouring parts of North West, Limpopo and Mpumalanga.
Limpopo was therefore already part of a wider geographical pattern associated with lower levels of adult illiteracy around Gauteng.
The province did not, however, form one large uniform cold spot. Sections of Limpopo were classified as not statistically significant, meaning the neighbouring values did not form a strong enough cluster to be identified as either a high- or low-illiteracy area.
The same distinction remains important in the 2022 picture.
The geography has changed since 1996
The latest analysis shows that adult illiteracy remains spatially clustered, but the extent and intensity of the clustering have declined.
In 1996, the strongest high-illiteracy hotspot was in north-eastern KwaZulu-Natal around Umkhanyakude, where clustering was significant at the 99% confidence level.
The hotspot extended into surrounding districts, creating a broad zone of elevated adult illiteracy across much of KwaZulu-Natal.
By 2022, Umkhanyakude remained the strongest hotspot, but the statistical significance had fallen to 95%. Other high-illiteracy clusters remained in parts of KwaZulu-Natal, while parts of the Eastern Cape became more prominent.
At the same time, Gauteng and the Western Cape continued to record strong cold spots of low adult illiteracy.
The Gauteng pattern extended into neighbouring areas of North West, Limpopo, Mpumalanga and Free State.
For Limpopo, one of the most notable findings is the size of the area that was classified as not statistically significant in 2022.
This should not be read as an indication that adult illiteracy does not exist in those communities. It means the analysis did not find a strong enough geographical concentration among neighbouring areas.
That makes the province’s literacy picture more complicated than simply labelling Limpopo as either a high- or low-illiteracy province.
The biggest change is the decline in clustering
Comparing the two Census periods shows a broader shift across the country.
The large high-illiteracy cluster visible across much of KwaZulu-Natal in 1996 had become considerably smaller by 2022.
Umkhanyakude remained a persistent hotspot, but it was less intense. The Eastern Cape also emerged more clearly in the latest analysis as an area with significant concentrations of high adult illiteracy.
Meanwhile, the strongest cold spots remained around Gauteng and the Western Cape.
By 2022, these low-illiteracy clusters extended more broadly into surrounding provinces, including parts of Limpopo.
Another major difference was the increase in areas where no statistically significant clustering was identified.
This suggests that adult illiteracy has become less geographically concentrated across many parts of the country.
The change is important because it shows that the literacy picture is not simply a story of provinces improving at the same pace. There are differences between neighbouring districts and communities, and those differences can change over time.
Older adults still carry much of the burden
The spatial analysis shows where illiteracy clusters occur, but national figures provide additional context on who remains most affected.
A 2025 Department of Higher Education and Training fact sheet recorded a decline in the national adult illiteracy rate from 15.8% in 2013 to 12.1% in 2019 and 9.7% in 2023.
Despite this progress, about 3.8 million adults were classified as illiterate in 2023.
Age remains one of the clearest differences.
Adults aged 60 to 64 had an illiteracy rate of 27.3% in 2023, while the rate among those aged 55 to 59 was 19%. Among people aged 50 to 54, it stood at 12.5%.
The rate among younger adults was considerably lower, reaching 2.5% among people aged 20 to 24.
The figures reflect the long-term effects of unequal access to education.
The Department links adult illiteracy to historical and socio-economic inequalities, including apartheid-era education policies, poverty, under-resourced schools and wider social inequalities.
Women also accounted for a larger share of adults classified as illiterate in 2023. The female rate was 10.2%, compared with 9.2% among men, with women making up 54.2% of the estimated 3.8 million adults.
These figures add context to the spatial findings: even as geographical concentrations become less pronounced, particular groups remain more vulnerable.
The gap extends beyond education
Adult illiteracy affects more than a person’s ability to read and write.
Limited literacy can make everyday tasks more difficult, including completing forms, understanding contracts, following written instructions, applying for jobs and using digital services.
In rural communities, these barriers can intersect with limited access to employment, transport, public services and technology.
The issue also has an economic dimension.
People running small businesses or informal enterprises may need to deal with invoices, registration documents, banking applications, contracts and online platforms. Limited literacy can make these processes more difficult and increase dependence on other people.
Healthcare can also become harder to navigate when patients struggle to understand written information, appointment details or medicine instructions.
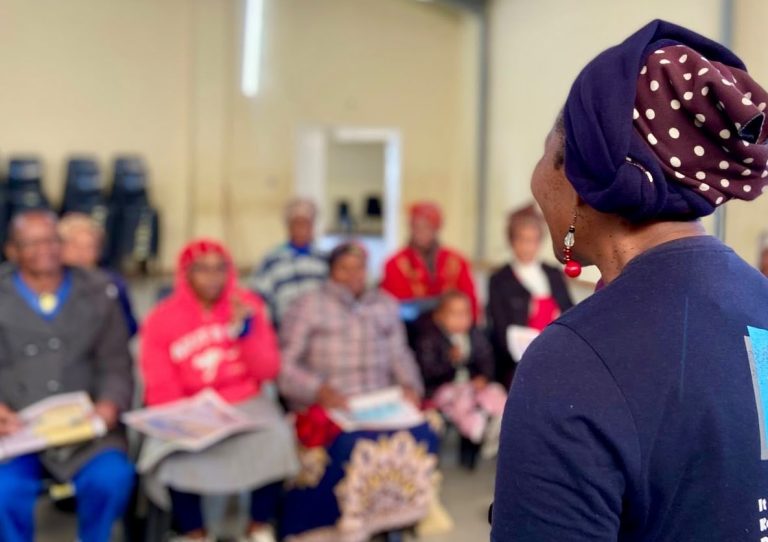
Community Education and Training colleges provide Adult Basic Education and Training as another route into education for adults and young people who did not complete formal schooling.
The challenge, however, remains reaching people who are outside the formal education system, particularly older adults who may have missed out on basic education many years ago.
Limpopo’s position on the changing literacy map therefore needs to be understood beyond a single provincial figure.
The latest analysis shows that parts of the province sit within broader areas of lower adult illiteracy linked to Gauteng, while substantial areas do not form statistically significant clusters.
At national level, the change since 1996 is clear: high-illiteracy clusters have become less widespread, while low-illiteracy areas around Gauteng and the Western Cape remain strong.
The remaining gaps are now less about one large national hotspot and more about understanding the communities and groups where limited education continues to affect people’s daily lives.
The latest map offers both a sign of progress and a reminder that the provincial picture is not uniform.

Be First to Comment